Main Page
The Top Menu

The top navigation menu (above) controls the three main parts of Repeat Browser functionality. From the left to right are the Homepage, Input Data, and Data Visualization. You can also get access to documentation and the links to Wang Lab and WashU Medical School.
The Tabs

On the very left is our logo of repeat browser.
Homepage

Click this tab, you will jump to the homepage with some brief introduction.

This tabs listed the number of current selected files and repeats. Click this tab, you will jump to the data selection section with 4 different selectable pages on the left bar.

Click this tab, you will jump to the data visualization section with 3 different selectable pages on the left bar.
Homepage

You can start exploring WashU Repeat Browser from the Homepage (above). There are some brief text and figure illustrations.
Github Link
The Github repo link provides the raw codes of this web based tool.
The two Buttons
The Start Browsing button will lead to Input Data page to start browsing.

The Start Guide Tour button is a tour guide with a tour window as above to introduce our entire site.
For those accessing our site for the first time, we highly recommend trying this button.
Input Data

Input Data page is the first step of utilizing the repeat browser. You can pick the interested data and repeat subfamilies in this tab. On the left, there is four different pages.
Data and Repeats Display
The Display Windows

On the first page, you will see the selected data and its repeats. Default data, along with repeats, is provided for first-time users. To remove the data or repeats, you can click either the close button or the “remove all” button.
Session File

Click this button, users can download the session files which containing all the selected data and repeats. Users can restore the repeat browser by uploading this session file.
The Format of Session File

The session file is a JSON file that includes data and repeats, as illustrated above. An example is provided below.
{
  "data": [
    {
      "Assay": "Histone ChIP-seq",
      "Biosample": "liver",
      "Control": "unknown",
      "Mode": "Experiment",
      "Organism": "mm10",
      "Tissue": "unknown",
      "Target": "H3K4me1",
      "id": "ENCFF007KSG",
      "Zarr": "https://s3-obs1.htcf.wustl.edu/repeatbrowser/mm10/chip-seq/histone/Processed_ENCFF007KSG_signal/ENCFF007KSG_signal.zarr/",
      "_id": 1
    }],
  "repeats": [
    {
      "size": 1,
      "name": "HERVK-int",
      "family": "ERVK",
      "class": "LTR"
    }
  ]
}
Files Selection

Pre-processed public datasets can be achieved at this page, the datasets are categorised by Assay and Species (above). You can also check the selected files or start the hands-on tour through the right panel of this page. Lastly, the default files and repeats can also be reset by the button below.
Detailed files information can be further explored by clicking the numbers to call the form below.
The information of datasets, including ID, Assasy, Biosample Type, Experiment ID, Organism, and Status, can be explored. The green and red colors of Status column represent available and selected respectively. Users can simply click the status button to select the data.
To find the data they are interested in, users can utilize the search bar located in the top right corner of the page.
Basic Table

This is an overview table of all the data. Users can click the blue button in the red box to jump into the detailed data table.
Detailed Data Table

In this table, users can click the green button to select the data. You can use the search bar on the top right to find your interested data.
Reset Button

Recall that there is a default setting for the users who first time visit this website. Clicking this button can reset the data to the default data.
Selected Data Table

The data briefly displays some information of the selected data. The “Detailed Tour” button provides a tour guide.
Upload

Uploading page provides two functions, Upload Session Json and Zarr File URL, for users to upload their own data or restore the repeat browser.
You can upload the JSON session file that is downloaded or shared to achieve quick exploration between collaborators.
You can also upload the personalized Zarr file generated by our data processing pipeline (detailed information can be checked via this link)
Upload Session Json File

For the Upload Session Json, the session Json can be obtained from Selected Data site. You can click to choose the session file to upload or drag and drop. After determine the session file, click the upload button.
Upload Zarr File

For the Zarr File URL, users can utilize our pipeline to create their our zarr file. And input the Zarr url to the link.
Important note: The Zarr File must be in an online version; only the URL is functional, and local paths will not work.
Create a URL with Local Path
For those who run our pipeline with local devices, we provide a method to upload the local Zarr file with URL.
Step one, install http-server.
brew install http-server
For those who has the npm packages,
npm install http-server
Step two, change the path to where your Zarr files located.
cd /path/to/Zarr/
Step three, run the http-server commands.
http-server --cors
if your default port is occupied, try these parameters.
http-server --cors -p 8081 -a 127.0.0.1
Step Four, copy the link on the setting port and input it to the Zarr File URL. Here’s an example:

Create Zarr File

We offer an open-source pipeline for users to generate the Zarr file. Feel free to click on the blue link or the GitHub icon to visit the GitHub repository and explore it!
The detailed illustration is provided in the Github repo.
Repeats Selection

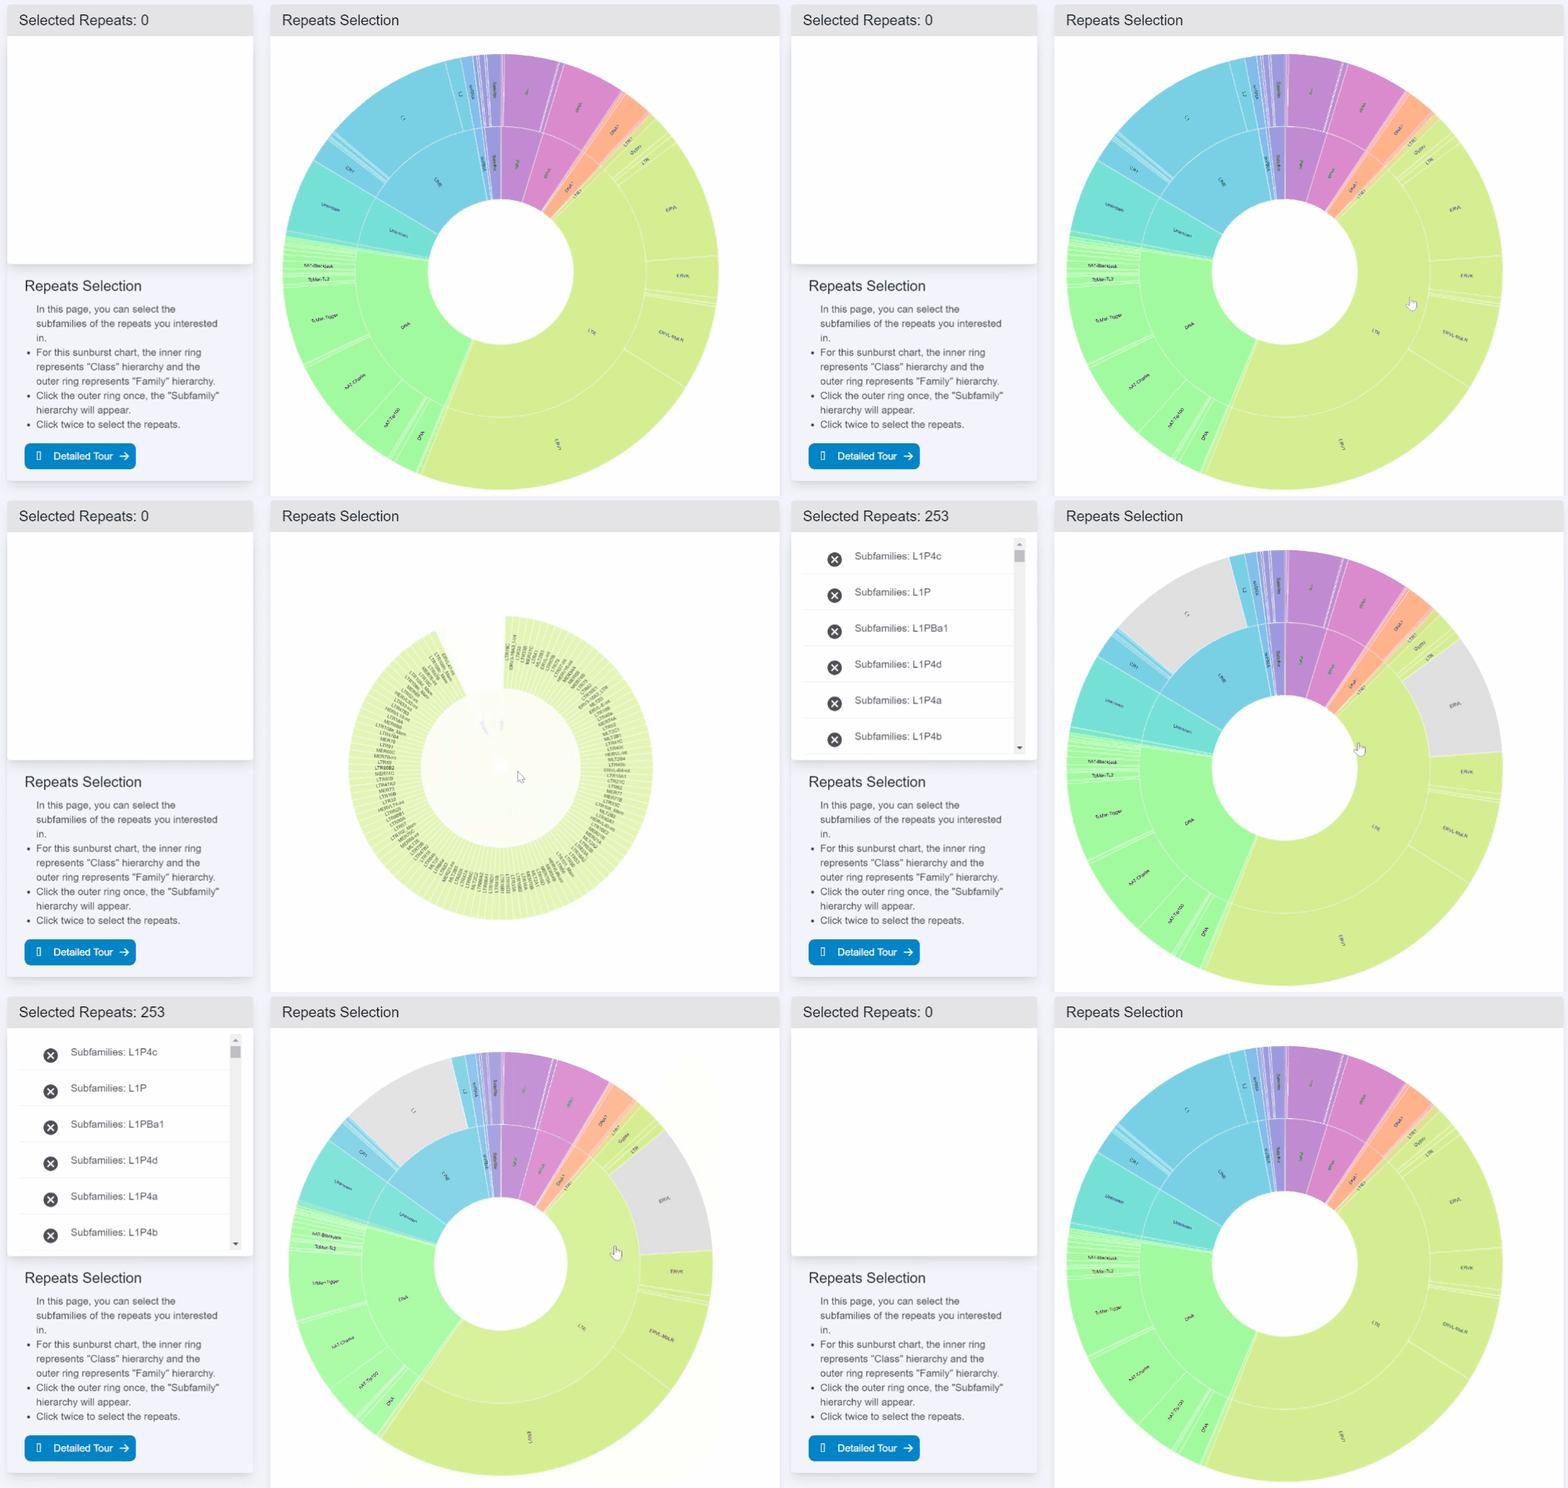
The Repeats page (above) features a sunburst plot for convenient selection of repeats at the class, family, and subfamily levels. Users can utilize the Repeats Search bar to locate a specific transposable element (TE) subfamily.
On the left is a window to display the selected repeats and a brief introduction.
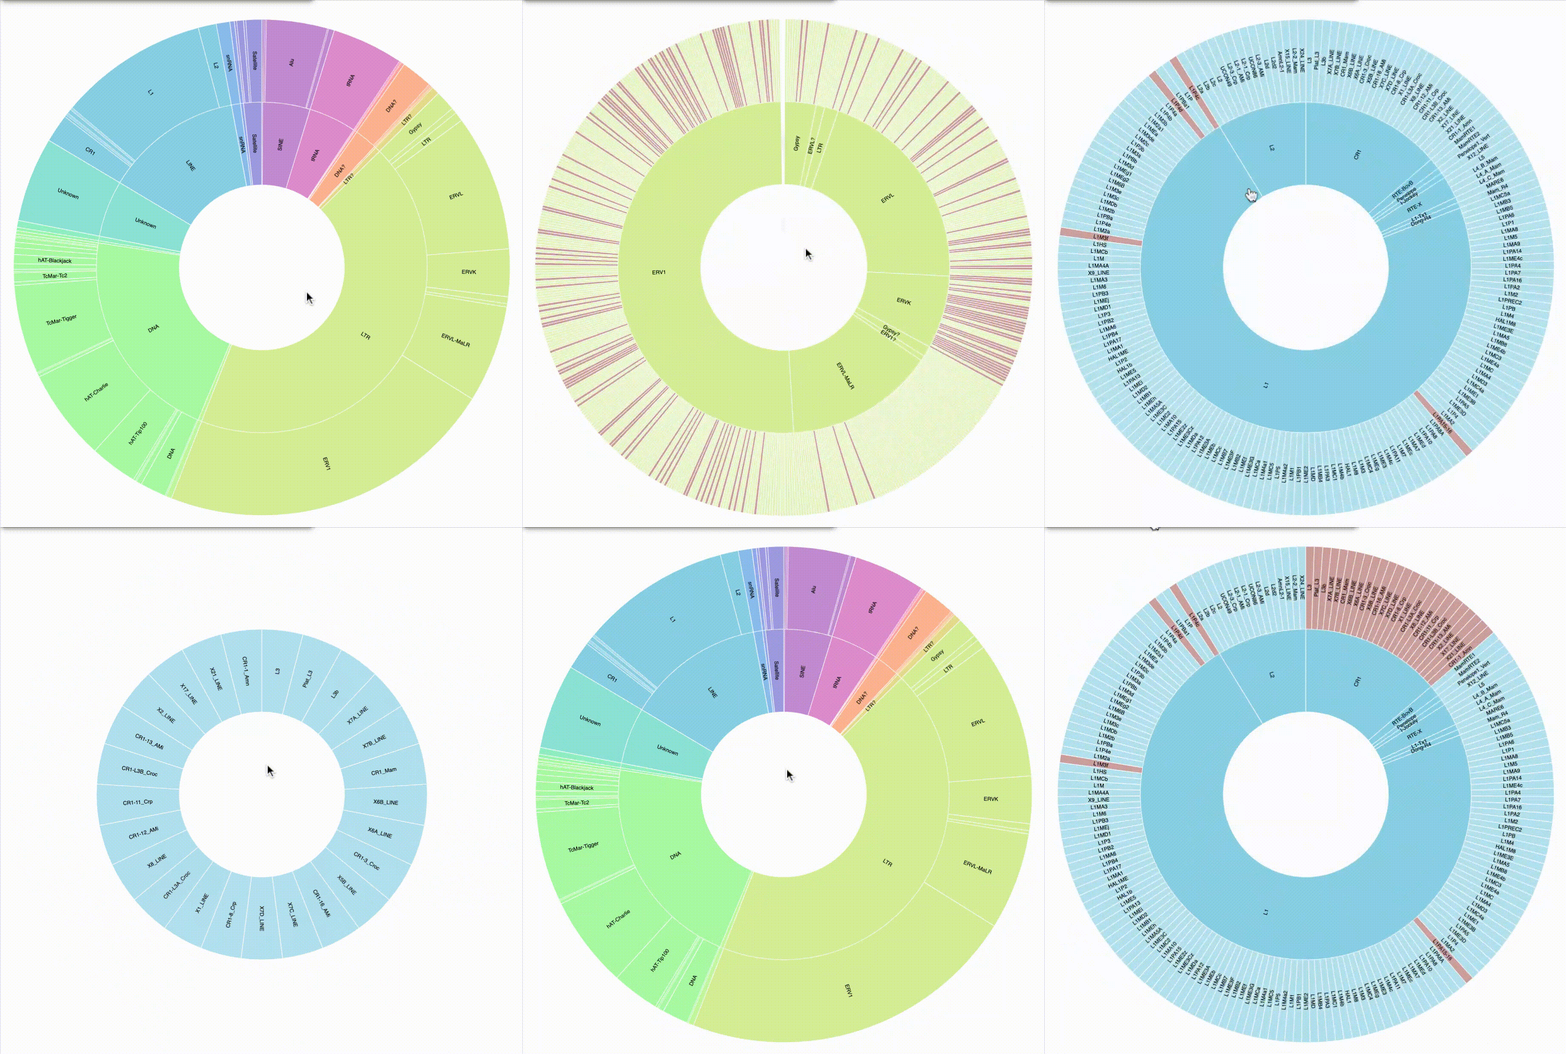
For this sunburst chart, the inner ring represents “Class” hierarchy and the outer ring represents “Family” hierarchy.
Click Once: Click the outer ring once, Zoom in to the “Subfamily” hierarchy.
Click twice: Click twice to select the repeats and back to the default view.
Click the white space in the middle once: Zoom out to the previous class.
Sunburst plot can be played with via the GIF demo below.
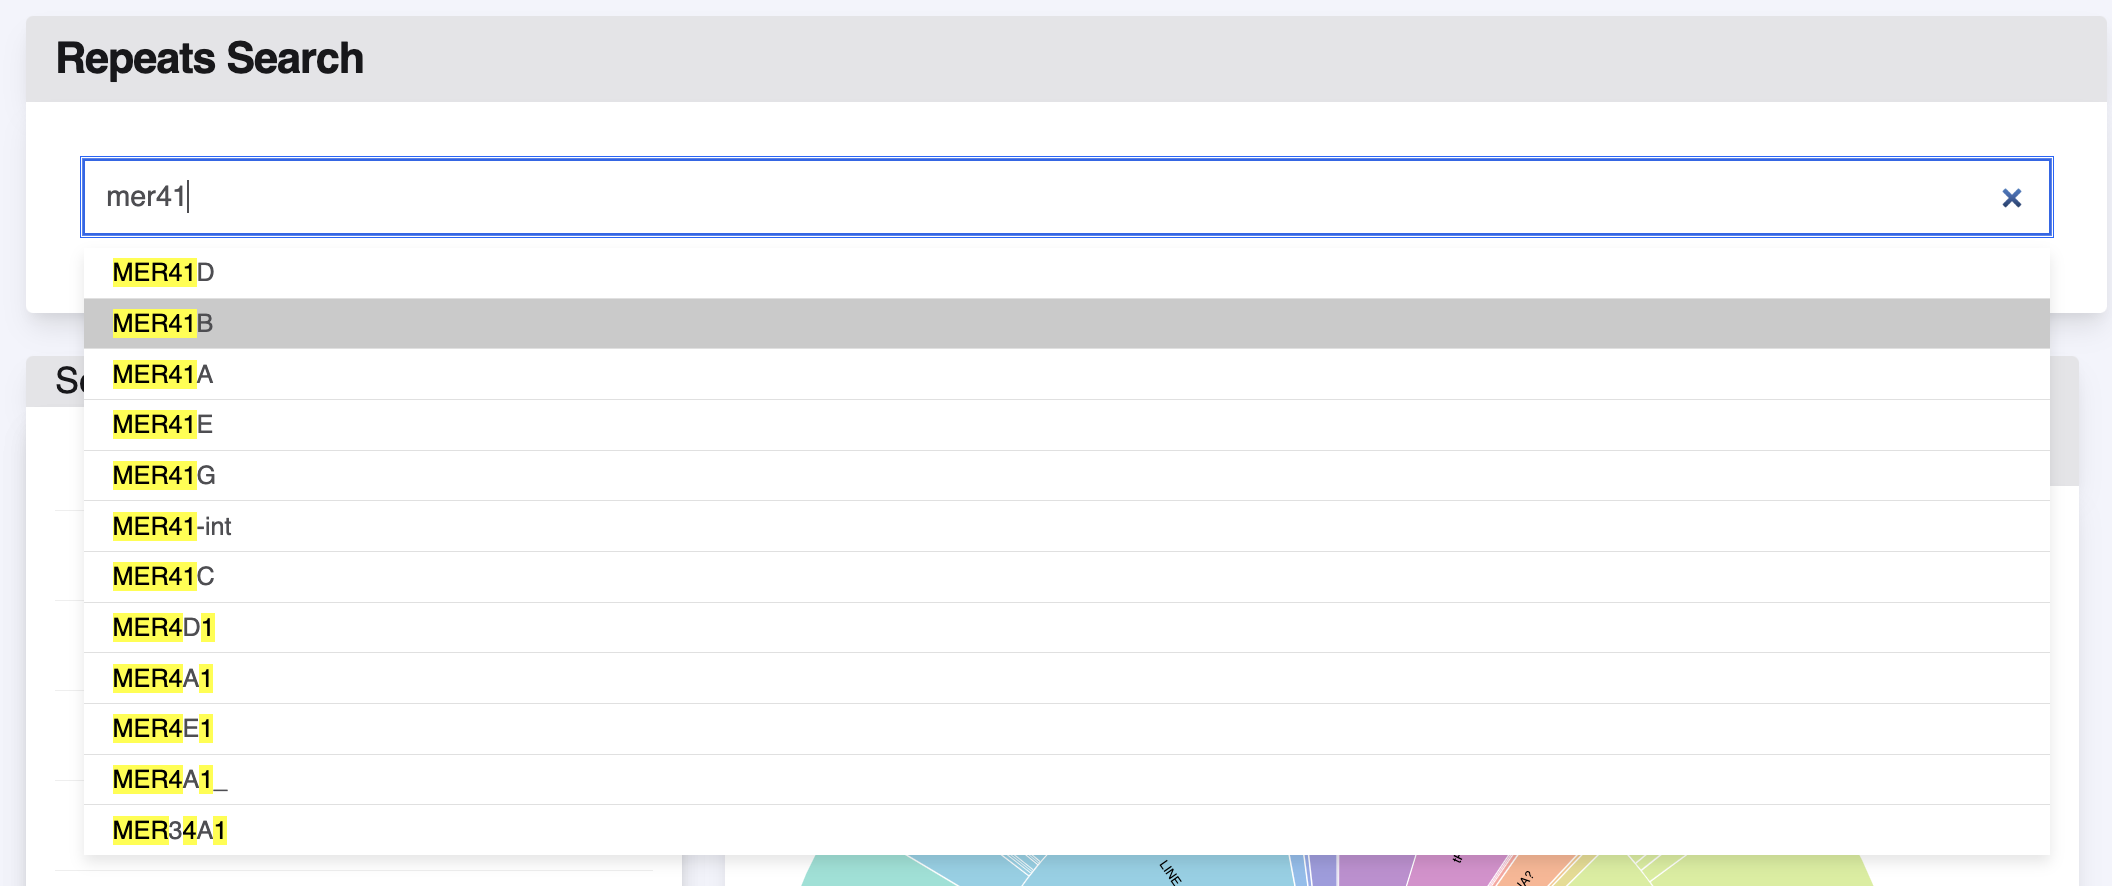
Click the repeat in the drop-down list, the clicked repeat will be added.
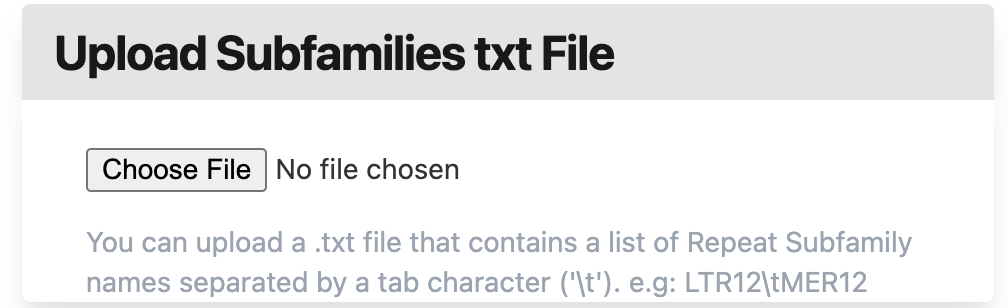
Input a txt file containing a list of names of repeat subfamilies.
Single click on the panel would lead to downstream level (class to family to subfamily), and the first double click on the panel will select specific family, or subfamily, in which case the colorful panel would become gray. The second double click on the panel would undo the selction operation which would lead the panel to colorful one. In contrast, the single click on the central white region would back to the upstream level, while the double click on the central white region would back to the class level by default.
Our website includes a useful search feature that allows users to quickly find and select their desired subfamily. By simply typing the name of the subfamily in the search bar and clicking on the corresponding item in the dropdown menu, the subfamily will be selected.
Data Visualization

Data Visualization Tab is the main function of WashU Repeat Browser. It contains three pages in this tab.
Heatmap View

Heatmap View (above) is the first plot embedded in WashU Repeat Browser. It provides the functions where users can cluster columns(repeats) or rows(datasets), or both, as well as re-order the heatmap by any of the methods, alphabetic order, rank by sum, or rank by variance. You can also set the opacity and the number of rows you want to show by the side bar. The different colors at the edge of the matrix denote the different class/family (for the column) and different datasets (for the row).
Data Display

In this window, we provide a brief view of selected data in heatmap.
Function Bar of Heatmap
This function bar contains several functions for the heatmap.
Function Icons

These four icons provides four different functions.
Share the weblink.
Screenshot.
Download the heatmap matrix.
Crop the matrix into a smaller heatmap.
Heatmap Rank Order

We provide four different rank order to display the heatmap.
Heatmap Slider Bar

We provide some slider bars to customize your parameters of the heatmap. Additionally, there’s a search bar tp search the data.
A Simple Demo

Consensus View

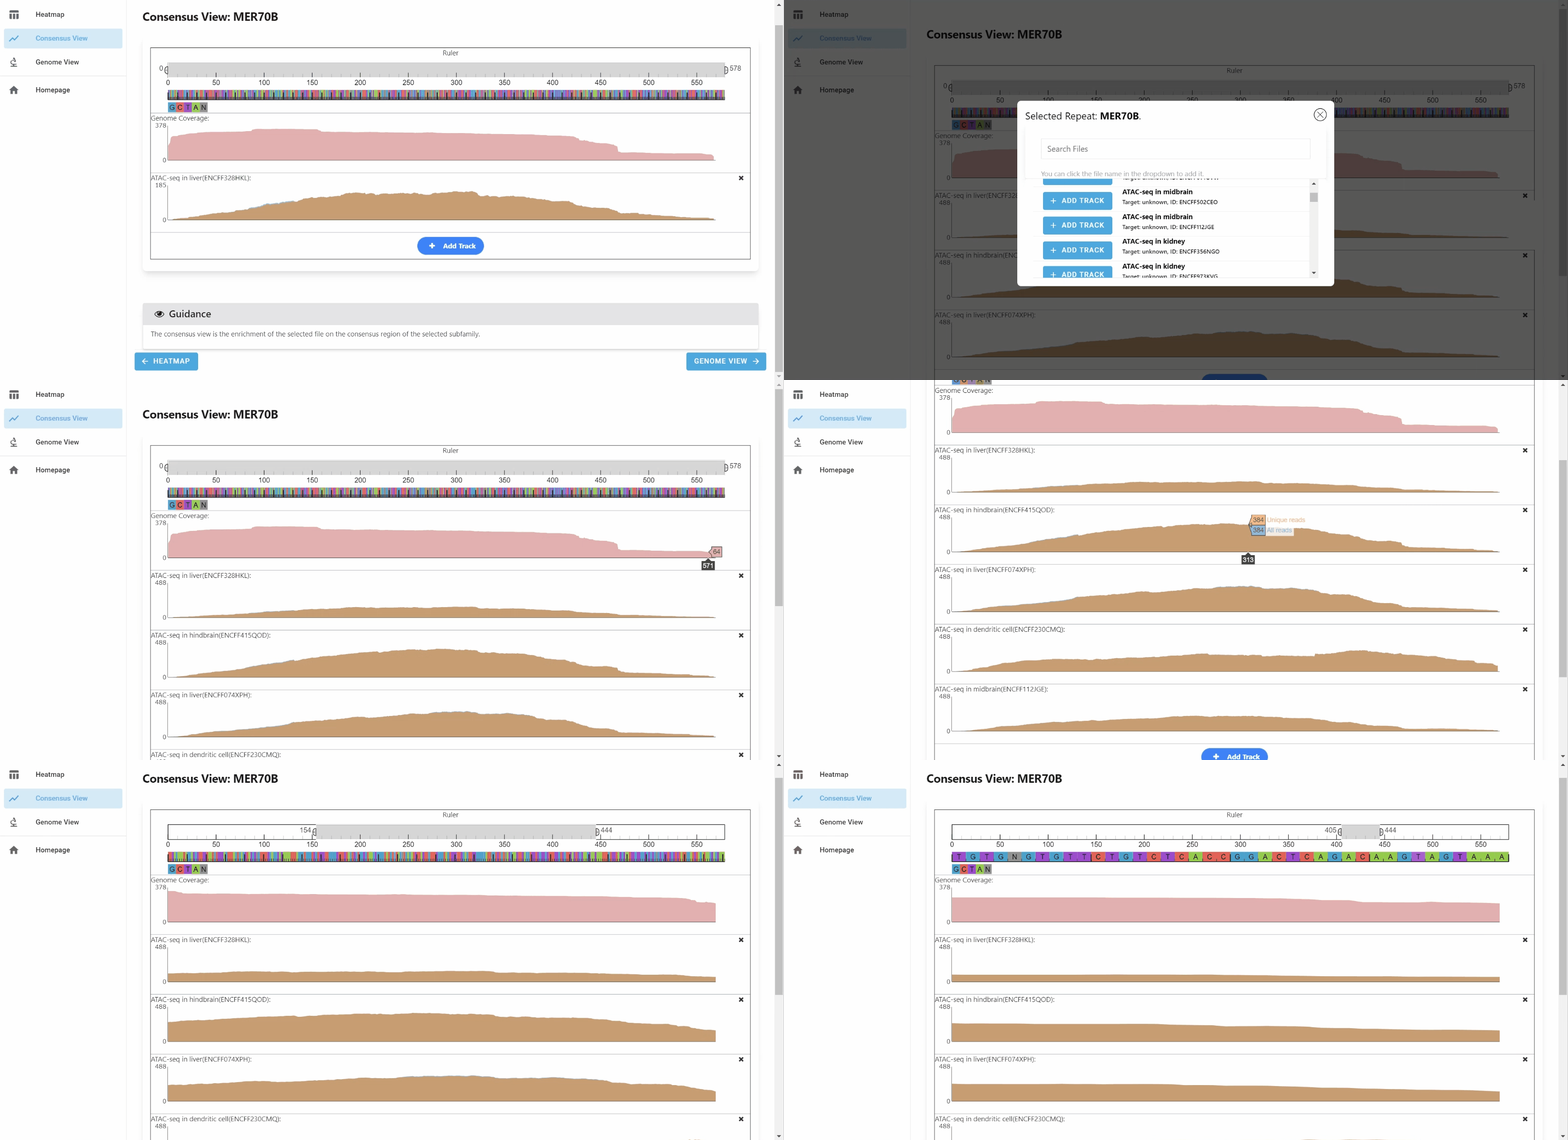
Consensus View has
Ruler Track
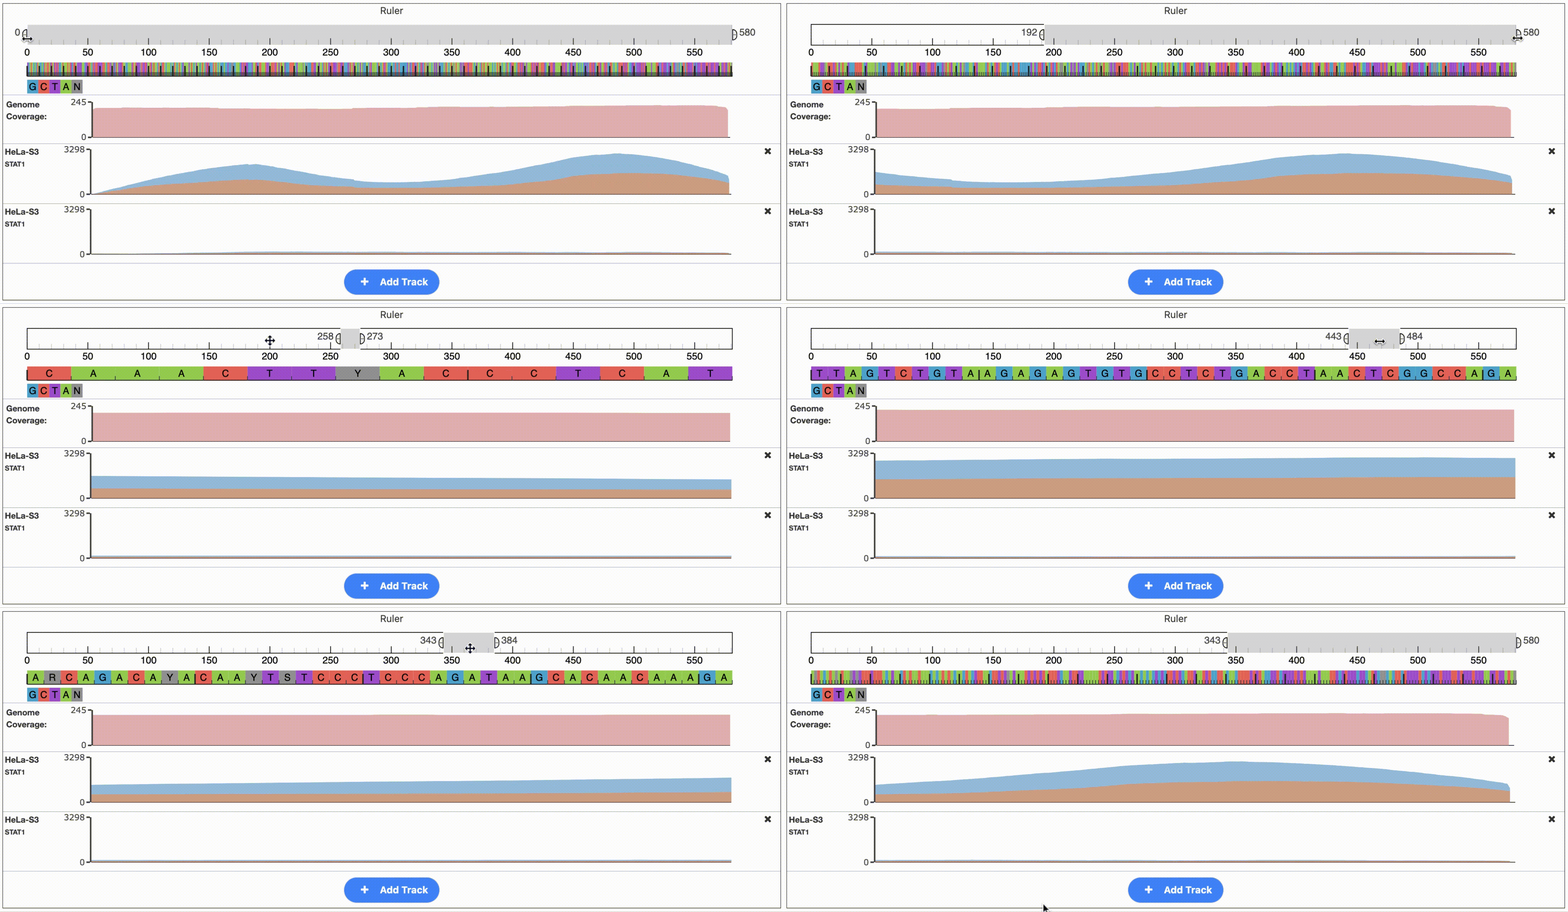
Dragging this ruler, you can change the area of the consensus view displayed.
Base-Pair Track

This base pair track displays the base pair in the consensus region. It won’t show the character unless the region is less than 50 base pairs.
Main Tracks of Consensus View

These three tracks are
Genome Coverage. It is the count of genome copies on each base pairs of consensus region.
The Read Counts. The second and third tracks are the key tracks. They provide the read counts in user selected data on the consensus region. For the ChIP-seq data, it has two tracks (signal and control). For the others sequencing data, it will only have one track (signal).
Add Tracks Button

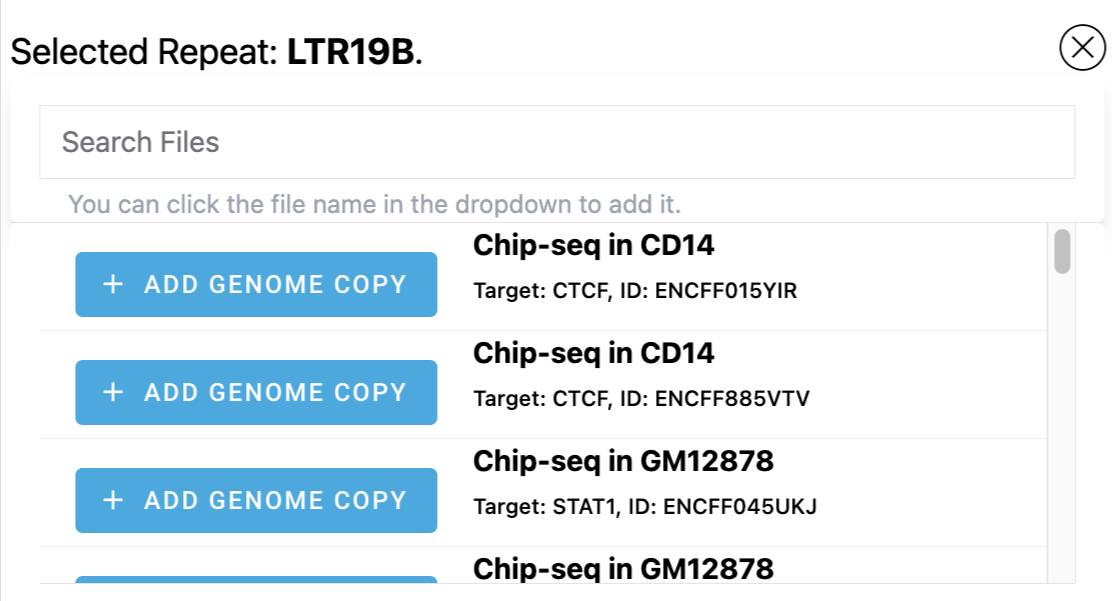
Users may want to add some more tracks of the other data. The figure shows the panel.
Genome View

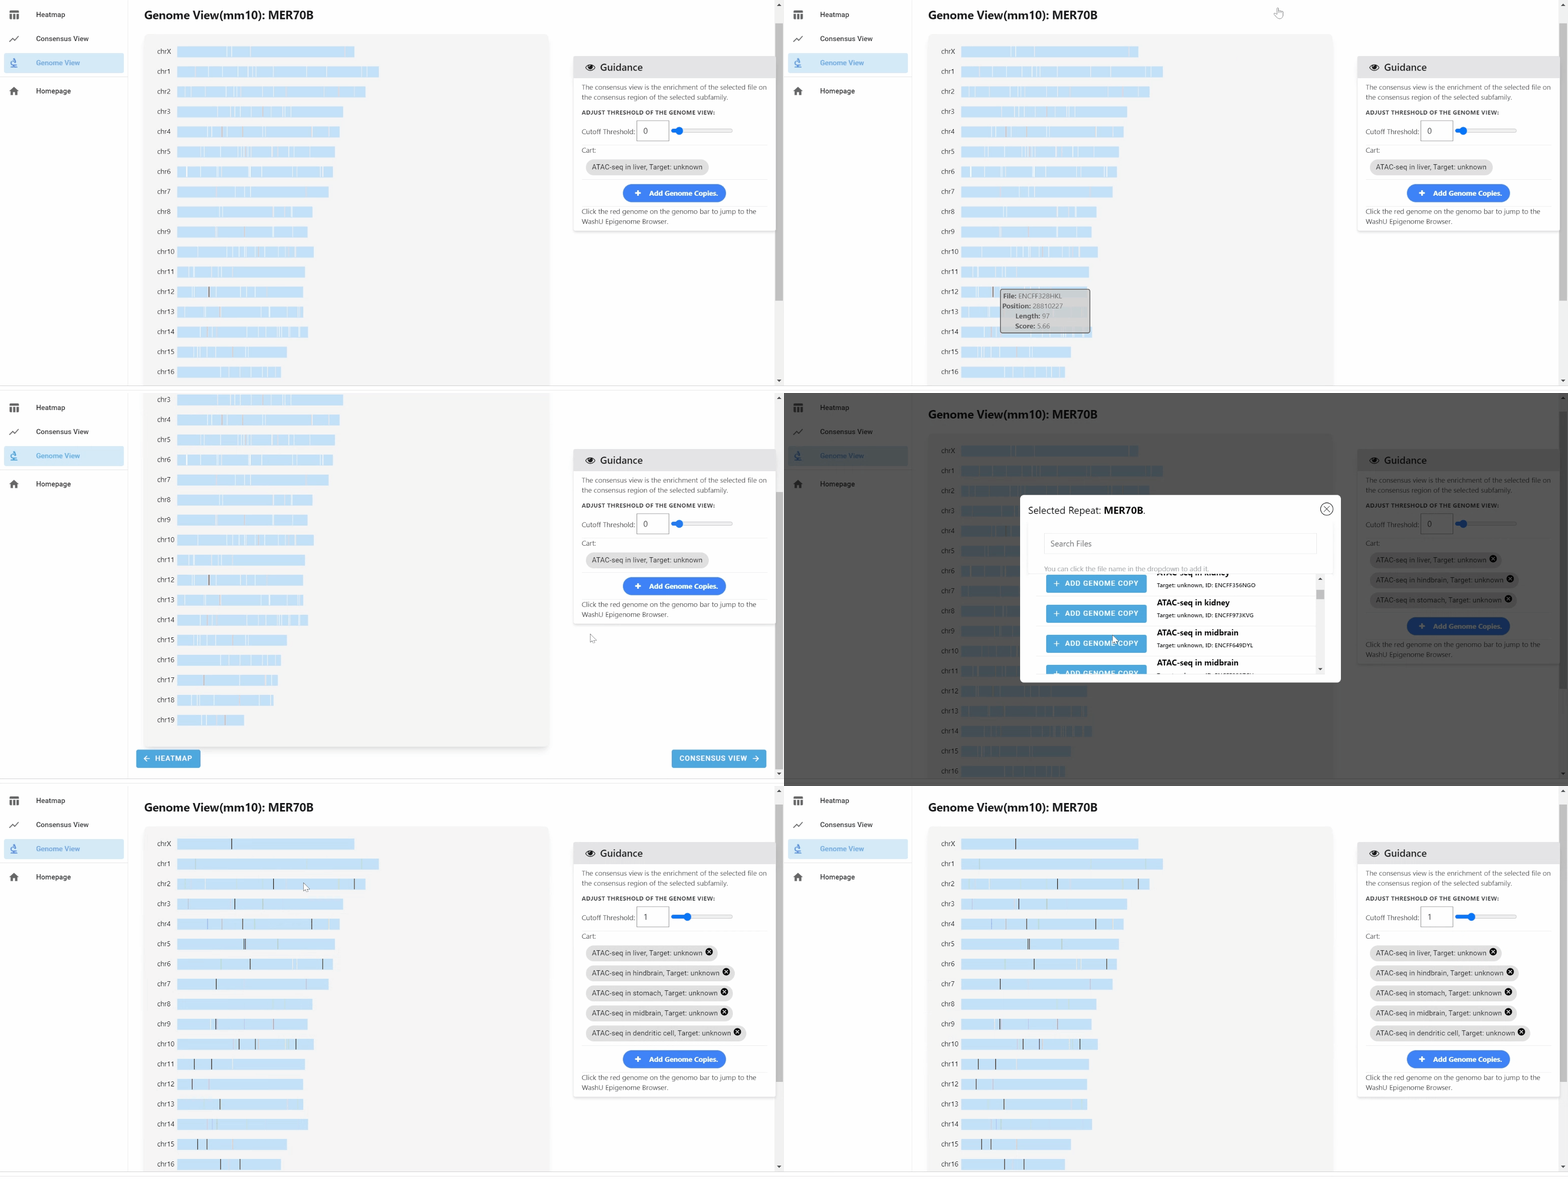
Genome view (above) is a bird’s eye view of different locations of TE copies on the genome. A filter sets the threshold of enrichment scores of corresponding TE copies is provided.
Genome Chart

This is genome view, each bar in the chromosome is a genome copy. The color corresponds to the RPKM value, with deeper colors indicating higher RPKM values.
Genome Plot Chart

Regarding the chromosome, we provide a dot plot for a detailed view. To access the plot, simply click on the blue section of the chromosome bar.
Link to WashU Genome Browser Panel

Click the dot in the genome plot, and you can jump to the WashU genome browser. Click Ok in this alert window.

Filter Bar

If you wish to filter genome copies on the chromosome, you can utilize the filter bar. This tool can exclude genome copies that are below the specified threshold.
Genome View Cart
You have the option to add additional data to the cart. The contents of the cart will then be displayed on the genome view.
And here is the panel to add data.
You can also switch to the CAGE-seq heatmap through the Assay Type drop down list.
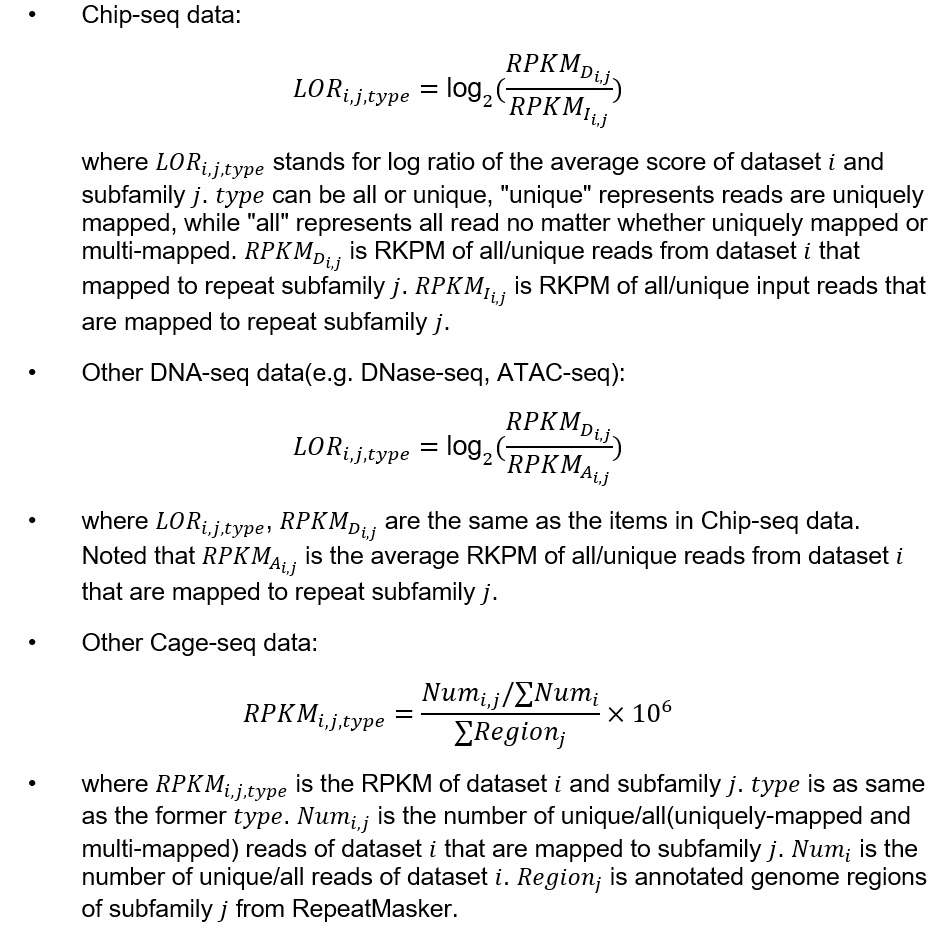
Heatmap view of enrichment scores of datasets on TE subfamilies. Users can click a specific cell where each cell denotes ratio of average score or RPKM as per below.
Repeat Browser Data Processing
Data Processing Pipeline
We have a GitHub repo stores the code of data processing pipeline. You can check this repo for the detailed information.
Prerequisites
2. Install the required packages of python
# Install dependencies from requirements.txt
pip install -r requirements.txt
Implementation
Step 0. Align the reads
If you already have a bam file, this step can be omitted. If not, here’s some tutorials to align the reads in different scenarios.
(1). ChIP-Seq data
We recommend users use BWA to align the ChIP-Seq data.
# change the path to the bwa folder
./bwa index ref.fa read-se.fq.gz | gzip -3 > aln-se.sam.gz
(2). CAGE-Seq data
We recommend users to use STAR to align the CAGE-Seq data. Since we are focused on the multireads, it will have some differences from the default settings of STAR.
STAR --chimSegmentMin 100
    --outFilterMultimapNmax 100
    --winAnchorMultimapNmax 100
    --alignEndsType EndToEnd
    --alignEndsProtrude 100 DiscordantPair
    --outFilterScoreMinOverLread 0.4
    --outFilterMatchNminOverLread 0.4
    --outSAMtype BAM Unsorted
    --outSAMattributes All
    --outSAMstrandField intronMotif
    --outSAMattrIHstart 0
    --readFilesCommand zcat
    --chimOutType WithinBAM SoftClip
We consult the SQuIRE repository for guidance on the STAR parameters related to handling CAGE-Seq multireads.
Step 1. Run the pipeline
You can choose to run the bash file or run the whole pipeline by the bash file run.sh.
Here are some sample files for human you may need:
--chrom_size
--subfam_size
--rmsk_path
Repeat size file: here (length of consensus sequence of repeat subfamily)
hg19: Repeat annotation: download from UCSC
hg19: Chromosome size file: Full Lite (without supercontigs)
hg38: Repeat annotation: download from UCSC
hg38: Chromosome size file: Full Lite (without supercontigs)
For the bash file:
(1). The default scenario
In this scenario, you only have one bam file to process. And this bam file is not from CAGE-Seq
bash run.sh --bam_file /path/to/your/bam_file
            --output_path /path/to/output
            --chrom_size /path/to/chrom_size_file
            --subfam_size /path/to/subfam_size_file
            --rmsk_path /path/to/rmsk_file
(2). The data is from ChIP-Seq
In this case, it will have two bam files. One is the signal bam file, another is IgG control bam file.
bash run.sh --signal_bam_file /path/to/signal.bam
            --control_bam_file /path/to/control.bam
            --output_path /path/to/output
            --chrom_size /path/to/chrom_size_file
            --subfam_size /path/to/subfam_size_file
            --rmsk_path /path/to/rmsk_file
(3). The data is from CAGE-Seq
In this case, you will have to set the length of cage_window, which is the length of basepairs segments around 5’ end during our process.
The default value of cage_window is 20, which means the segment we select is from 20 bp in front of 5’ end to 20 bp behind it.
bash run.sh --bam_file /path/to/your/bam_file
            --output_path /path/to/output
            --chrom_size /path/to/chrom_size_file
            --subfam_size /path/to/subfam_size_file
            --rmsk_path /path/to/rmsk_file
            --cage_window 20
We provide some sample files in the Prerequisites section. Repeat-Browser_data_processing/README.md at main · Jiawei-Shen/Repeat-Browser_data_processing
Zarr Data Format
The Zarr file is essentially a folder containing all the essential information. Below is a sample representation of a Zarr file structure. For more detailed information, refer to the Zarr Documentation.
To utilize Zarr in Repeat Browser, simply input the path to the Zarr file, for example: /path/to/your.zarr/.
/your.zarr
├── all_bigwig
│   └── 0.0 (chunks)
├── uni_bigwig
│   └── 0.0 (chunks)
├── subfam_stat
│   └── 0.0 (chunks)
├── loci_*
│   └── 0.0 (chunks)
├── .zattrs
├── .zgroup
└── .zmetadata